Skip to content

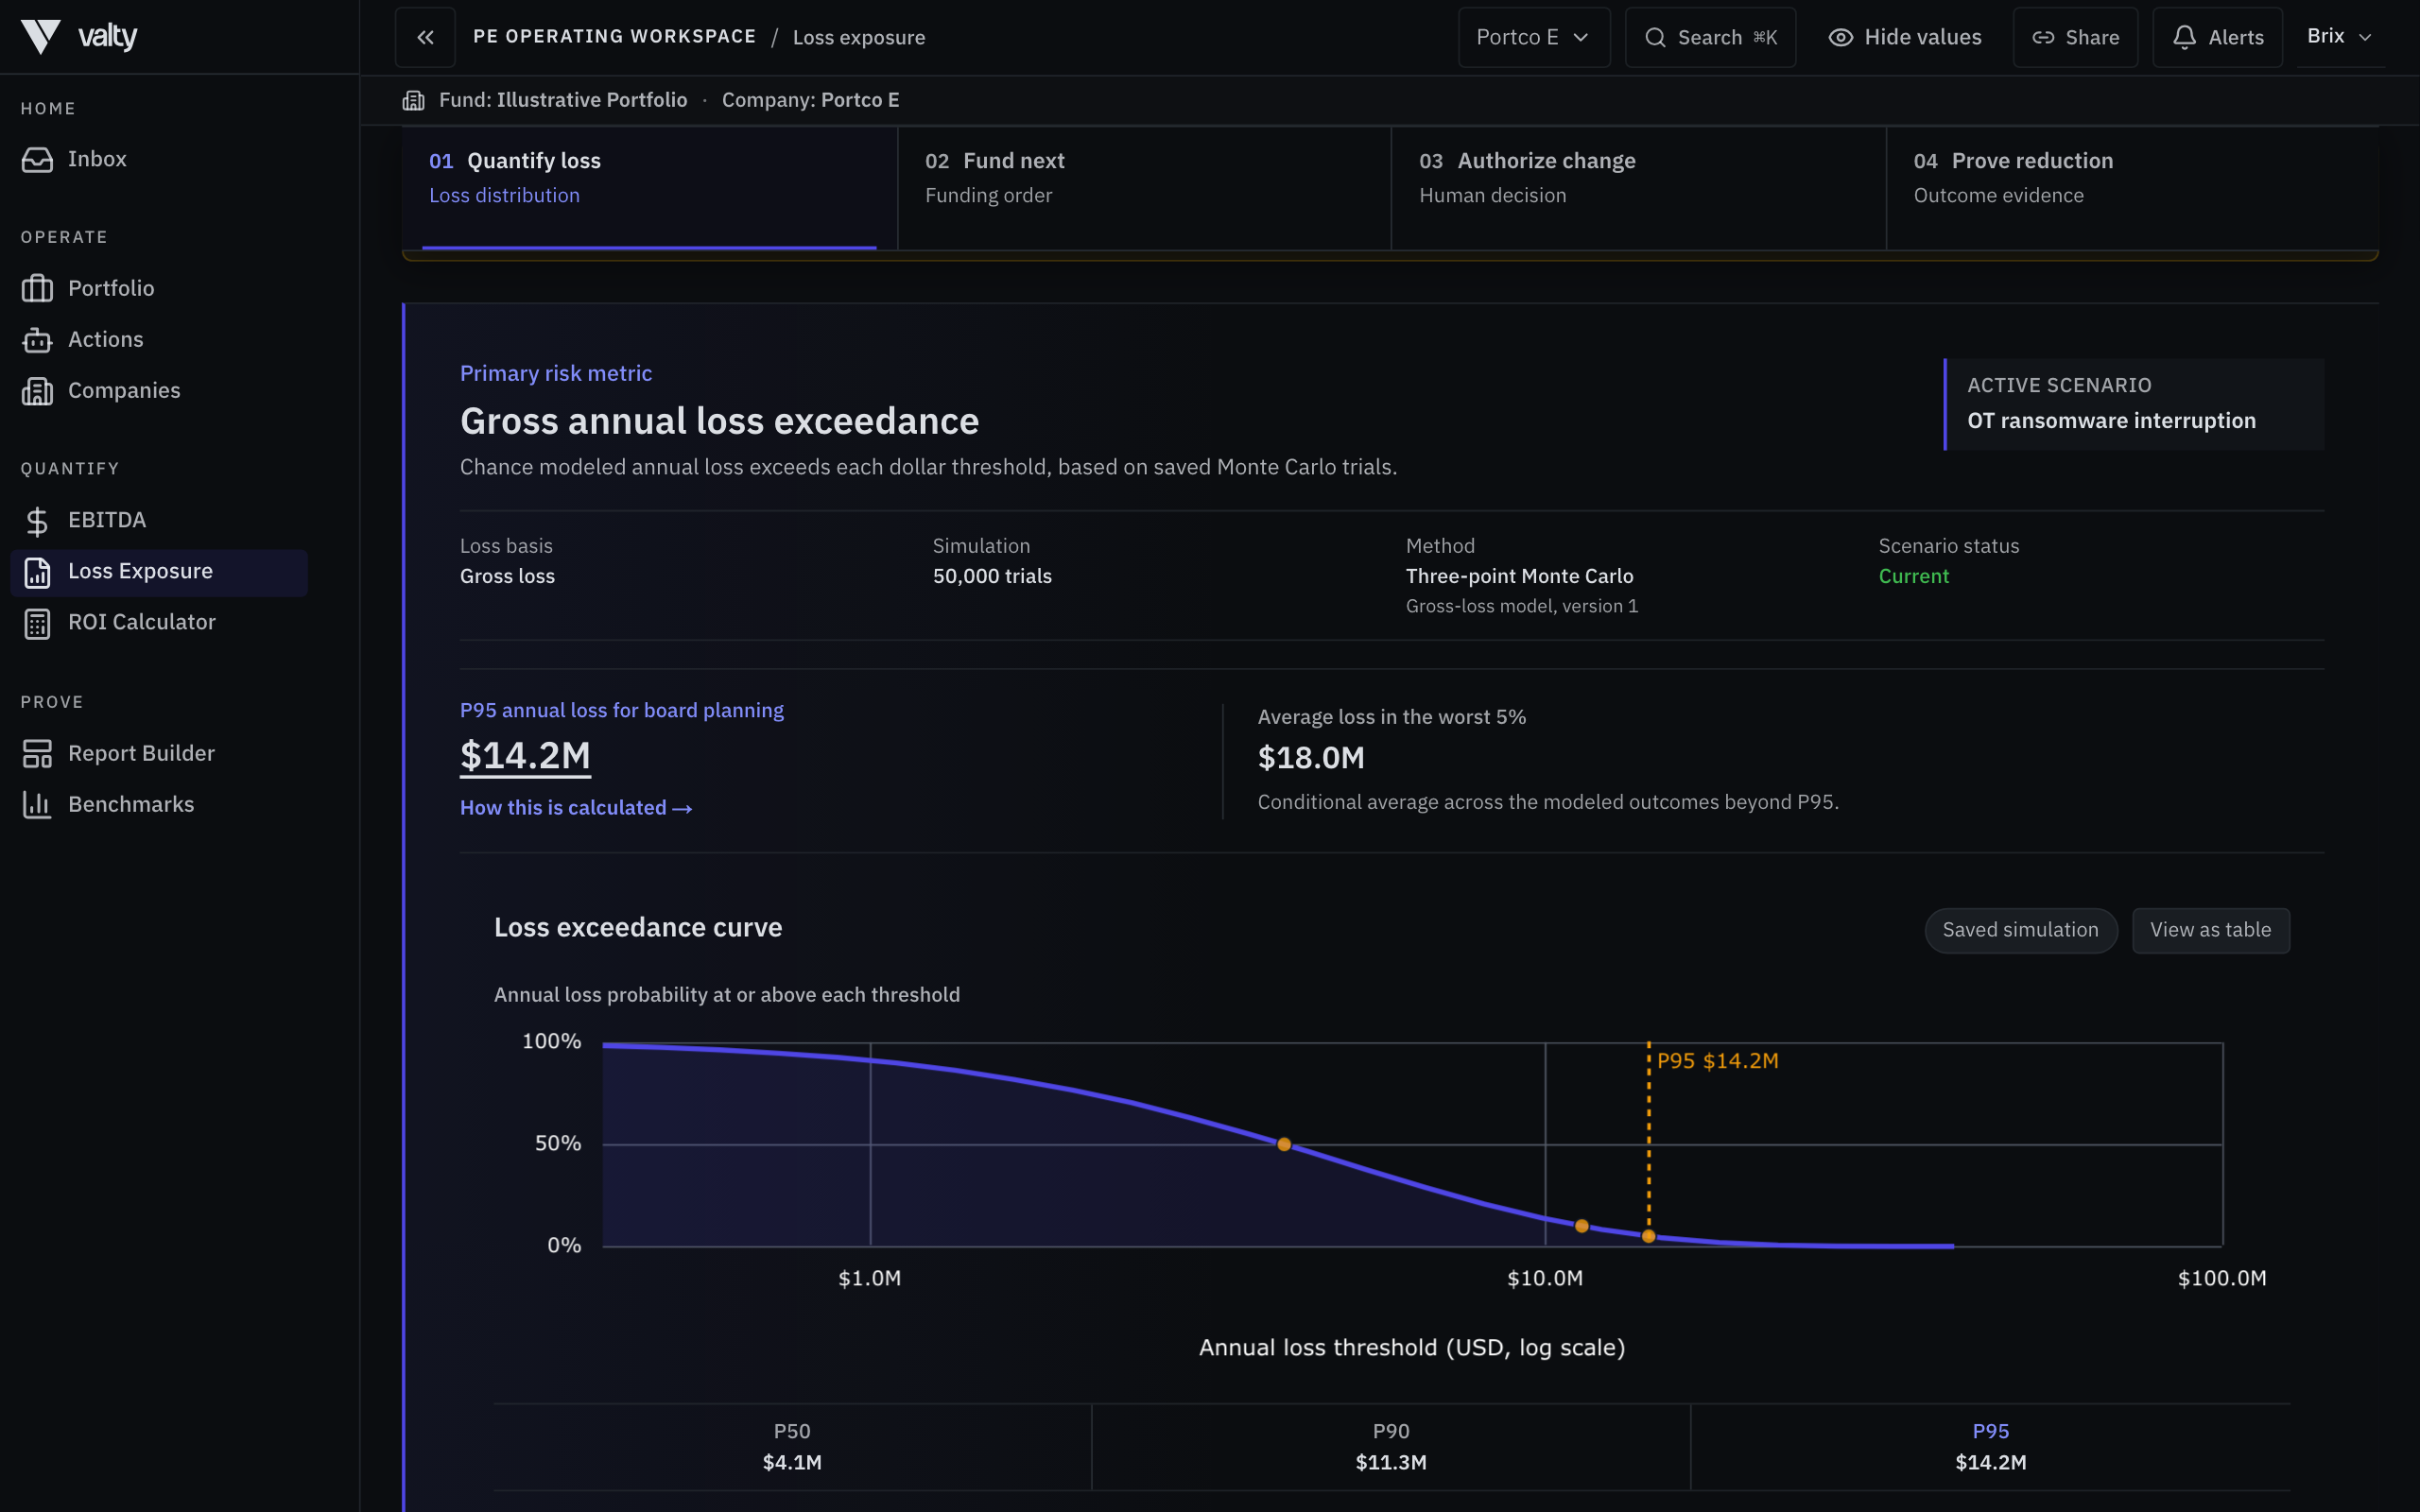
Product preview: Portfolio Command dashboard showing portfolio cyber loss exposure, company rollup, and funding-order decisions for PE operating partners. Illustrative demo data, not a customer outcome.

Financial cyber exposure for PE portfolios

Know which portfolio company carries the greatest financial cyber exposure. And what to fund first.

Valty turns the security findings you already have into a comparable EBITDA-impacting cyber loss-exposure range, net of insurance. The assumptions, evidence lineage, and confidence range behind every number stay visible.

Every number shows its work.

One-company, capacity-capped design-partner sprint — not GA. By continuing you agree to be contacted about a design-partner sprint. Privacy.

PortfolioOne comparable dollar viewP10–P90Confidence range visible10,000Monte Carlo runs per exposureSource-linkedEvidence lineage attachedSeeded demo · methods note
Portfolio Command

Highest exposure is not always the first check you write. Valty makes both decisions explicit.

See where financial cyber exposure is concentrated, then allocate a constrained budget to the combination of fixes that removes the most modeled exposure.

The claim

Five portcos · $1.1M to $5.7M modeled

FAIR-aligned annual loss per company, 10,000 Monte Carlo runs per exposure, stated as a P10–P90 range. Never a point guess.

The evidence

Every figure carries its source

Controls verified by API against the tools each portco already runs, with freshness shown: MFA coverage 1 day old, attack surface 3 days old.

The decision

$538K of $550K · $6.8M reduced

A FUND / NEXT / HOLD order under an approved budget cap. The next fix waits for capacity; holds wait for evidence. Not a valuation.

Valty Portfolio Command Center, captured from the console on the seeded demo portfolio: a funding order of five remediation moves under a $550K approved cap with FUND, NEXT, and HOLD decisions and an allocation summary, above a portfolio risk heatmap showing each company's compliance, value at risk, modeled annual loss, and critical findings. Not a customer portfolio.
Portfolio CommandPortfolio Command, captured from the Valty console on the seeded demo portfolio: five remediation moves allocated under a $550K approved cap with FUND, NEXT, and HOLD decisions, above each company’s modeled annual loss. A screenshot of the product, not a mockup.
Inspect the assumptions

Open the worked example before you apply.

Portfolio Command ranked the funding order. This step is different: inspect the assumptions, evidence lineage, confidence range, and blocked claims behind that decision — ungated, labeled illustrative, not a second portfolio table pitch.

Assumptions

Every modeled figure lists the inputs and defaults it depends on — inspect before you fund.

Evidence

Lineage and freshness sit next to the claim so stale or missing proof cannot hide.

Confidence

P10–P90 ranges replace false precision; blocked claims stay blocked until evidence lands.

Limits

Illustrative demo data is labeled as such — not a customer portfolio or customer outcome.

See the worked example

Ungated · methods note attached.

EBITDA Bridge

Watch cyber risk show up in the operating number.

See how modeled cyber exposure adjusts reported EBITDA. This illustrative $400M revenue manufacturer shows a $4–7M bridge (base case $5.4M) from reported to adjusted EBITDA, modeled with FAIR and 10,000 Monte Carlo simulations. Sensitivity, not a valuation opinion.

Starting
$42.0M
Reported EBITDA
RNSMRansomware exposure−$1.8M
DBRCData breach liability−$2.1M
CMPLCompliance penalties−$0.9M
INTRBusiness interruption−$1.4M
INSRInsurance recovery+$0.8M
Adjusted
$36.6M
After cyber risk · $35–38M range
The board asks for risk in dollars. Heatmaps cannot answer.

More data does not move an IC memo.
A dollar number does.

Your CISO has controls, alerts, and heatmaps. You still do not have a number you can put into an IC memo.

  • Heatmaps

    Cannot answer the IC funding question when the board asks for cyber risk in dollars.

    Valty method
  • $4.7M

    Average industry cost of a data breach (IBM). Most boards still cannot quantify their own exposure.

    IBM 2024
  • P10–P90

    Every modeled figure ships as a range with method and source, not a single point the board cannot challenge.

    Valty method
Independent research

The operating problem is already measured.

Independent research already measures cyber risk as deal and hold-period impact. Directors are asking management to report it in terms the business can act on.

Private equity transaction risk

Cybersecurity has evolved into a material transaction risk, becoming a direct threat to deal flow and valuation in private equity.

Kroll surveyed 325 private equity executives. Its February 2026 report found $2.1 million in average financial impact per incident and hold-period disruption at 80% of firms.

Dave Burg, Global Group Head of Cyber and Data Resilience at Kroll

Kroll · Cyber Risk at Scale · February 2026 (opens in a new tab)

From diligence to action

[Diligence observations] must get out of the reports and spreadsheets and onto the agenda.

Benjamin Eason, Managing Director of Cyber at Apollo Global Management

as quoted by EY · March 2023 (opens in a new tab)

Independent industry sources, cited for context. No affiliation, endorsement, or customer relationship with any organization named above is implied. Valty's own method, range, and claim boundary sit with each modeled dollar on this page.

Design-partner paths

Three design-partner paths. Pick the one that matches the decision.

Catalog-only modules stay on the capability map. These three lanes are the current design-partner motion, and each CTA opens a concrete next step — not a generic early-access ask.

Design partner · Portfolio Operations

Portfolio Command

Rank which portco carries the most financial cyber exposure and what to fund first under a constrained budget.

Design partnership

Bring one portfolio decision.
Leave with a defensible funding order.

Engagement modelCapacity-capped
Capacity-capped, founder-led. Not a public seat counter.
Adil Karam, founder and CEO of Valty

Adil Karam · Founder & CEO

You’ll work directly with me. Every application gets a personal reply. LinkedIn

One-company, capacity-capped design-partner sprint — not GA. By continuing you agree to be contacted about a design-partner sprint. Privacy.

Prefer email? partner@valty.ai

What you get
  • A scoped portfolio exposure model and constrained-budget funding order
  • A review of the assumptions, confidence ranges, and evidence gaps behind it
  • A claim-reviewed Proof Pack you can circulate internally
What we get
  • Structured feedback at the model review and Proof Pack review
  • Permission to use anonymized learnings only when separately approved
Best fit · PE operating or technology leaders with existing findings and a live funding decision

Common objections

Questions buyers ask before they engage.

These are the real questions a CISO, CFO, or PE operating partner asks about a cyber-risk platform that translates exposure into EBITDA impact. Answered directly, with the same claim discipline the product enforces.

Is the dollar number actually defensible?

Every financial output Valty produces carries four fields visible at the point of use: method, confidence band (P10 / base / P90), source coverage, and freshness date. The number is not decorative. It is a decision-support estimate built on a FAIR-aligned Monte Carlo model that shows its assumptions rather than burying them in a disclaimer.

What “defensible” means in practice: the EBITDA bridge shows which control gaps drive the exposure, what probability and magnitude assumptions underlie each scenario, and what the evidence coverage is for each assumption. A CFO or board reviewer can challenge any individual driver directly, rather than needing to accept or reject a headline figure on faith.

The model does not claim precision it cannot earn. Outputs are labeled decision-support estimates. When source coverage is thin, Valty labels the evidence gap and can block the claim from publication rather than silently publishing it. V1 does not automatically rewrite FAIR input ranges solely because source coverage is thin.

Method: FAIR-aligned Monte CarloConfidence: Displayed inline, P10–P90Freshness: Linked to source evidence refresh cadenceDesign partner
What do you need to install, and what access does this require?

Valty works from available evidence. It does not require a new scanner, agent install, or privileged shell access to your production environment. The typical starting point is read access to the evidence sources you already operate: a scanner export, a GRC control export, a cloud security posture signal, or an identity and findings feed.

The platform ingests, normalizes, and enriches what is already there, and sits above your systems as a translation layer. Getting started does not require replacing them. Source adapters are scoped by the customer; data flows into Valty on the terms you define, not ours.

In the design-partner stage, the integration is co-designed with your team. We map which evidence sources cover which control domains, agree on freshness thresholds and owner assignments, and scope the connector surface to exactly what the proof motion needs, and nothing more.

No new scanner requiredSource access: read-only, customer-scopedAugments your existing stack: no rip-and-replace to onboardDesign partner
How is this different from a GRC tool or a security rating?

Security ratings (BitSight, SecurityScorecard, etc.) score your external attack surface from the outside. They are fast and comparative, but they do not see your control verification state, your internal finding remediation status, or what the exposure means for EBITDA.

GRC platforms (ServiceNow, Archer, Tugboat Logic, etc.) track control frameworks, policy compliance, and audit workflows. They are the authoritative control register. What they rarely do is translate verified control gaps into a financial impact estimate a CFO or board can act on, or rank remediation priorities by ROI rather than framework weight.

Valty is a translation layer, not a competitor to either. It reads from your GRC and your scanner, maps control gaps to financial exposure scenarios using a FAIR-aligned model, ranks remediation by expected EBITDA impact per dollar spent, and packages the result as a board-ready proof artifact with source, confidence, and freshness visible. The GRC is still the control record. The rating is still the external signal. Valty is the business-impact layer above both.

Ratings: external signal only. Valty: verified internal control stateGRC: control record. Valty: financial translation + proof packagingIntegration: reads from both; no rip-and-replace to onboardDesign partner
Do you store our security data, and who owns it?

Your source-of-truth systems stay yours. Valty does not become the record system for your controls, findings, cloud posture, identity state, or financial model. Those remain in the systems you already operate.

Valty normalizes evidence from those systems into a proof object, a structured artifact that links the claim, the source, the confidence, the freshness, and the publication state. That proof object is tenant-isolated within your Valty workspace. No cross-tenant evidence exposure. No shared inference across accounts.

Data residency, retention periods, and subprocessor scope are addressed in the vendor security questionnaire and NDA, which are part of every design-partner onboarding. We do not publish detailed subprocessor lists without a reviewed trust-center artifact behind them. Contact security@valty.ai for the current security posture package.

Customer owns source systemsProof objects: tenant-isolated in your workspaceSecurity posture: available under NDA or design-partner onboardingDesign partner
You do not publish customer logos or references. Why should we trust this?

Valty has an active confidential design partnership, but does not publish the partner's identity or engagement specifics. We do not turn confidentiality into implied payment status, customer-authorized production scope, source authorization, or customer outcomes.

The current proof ladder is explicit. Valty-on-Valty dogfooding is real internal production evidence for the control, evidence, and governance workflows. The active design partnership adds external validation. The authenticated seeded demonstration shows the product path safely, but is not production or customer-outcome proof.

What buyers can evaluate directly is the deployed product, published methodology, inspectable proof model, and stage-labeled scenario library. Paid/customer outcomes, portability, and willingness to pay require separate evidence and are not represented here.

Stage-honest positioning is a constraint we enforce technically: the product’s claim-gate blocks unsupported assertions from being published in proof packs. We apply the same discipline to our own marketing copy.

Internal production proof: Valty-on-Valty dogfoodExternal validation: active confidential design partnershipPaid/customer outcomes: not representedDesign partner
Design partner

Know where cyber exposure is concentrated.
Fund what changes it most.

Bring the findings you already have. Valty makes them comparable, turns them into a reviewable funding order, and keeps the proof behind every recommendation attached.

One-company, capacity-capped design-partner sprint — not GA. By continuing you agree to be contacted about a design-partner sprint. Privacy.

PortfolioComparable dollar view
FundingOrdered by modeled impact
ProofAssumptions and evidence shown